SHOULD YOU DOWNLOAD YOUR WOOFER?
By Andy Lewis
Some audio systems include a woofer pointing toward the floor. This technique is sometimes referred to as downloading or downfiring the speaker. Listeners describe the sound of these systems in glowing terms, as if there were an inherent advantage to mounting a woofer in this way. They fail to specify, however, what this advantage is.
After considering this subject, I realized that I had many questions:
1. Can this design technique offer better bass with a given woofer?
2. Is a downfiring woofer really a selling point?
3. What are its disadvantages?
4. How far above the floor should I raise the bottom of the enclosure?
5. Will a carpeted surface have an effect on its performance?
I decided to perform some simple tests to answer these questions.
DOWNLOADED SYSTEM
Figure 1 shows a traditional, or standard, system with the woofer oriented vertically and affixed to a panel. Figure 2 shows a woofer mounted facing down, or downloaded, and the enclosure supported by feet, separating it from the floor. Figure 3 shows the same downloaded system on a carpeted surface, to see what effect this might have on a system's performance.
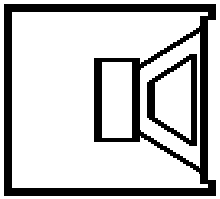
Fig. 1. Standard Vertical Configuration
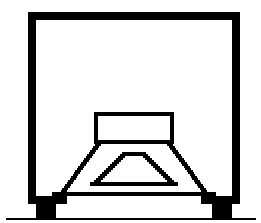
Fig. 2. Downloaded (Horizontal) System
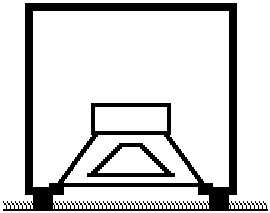
Fig 3. Downloaded System over Carpeted Surface.
In these illustrations, the enclosure is a simple sealed box, but in practice, the horizontal orientation is used in sealed, vented, and other systems. Although the measurements presented here are outside the discussion of primary loading methods (sealed versus ported, for example), we will see that positioning a woofer downward can affect your choice of enclosure type.
Three effects of downloading a woofer are: (1) an apparent change in the moving mass of the cone assembly, (2) a change in the damping characteristics (Q) of the driver, and (3) displacement of the cone assembly due to the force of gravity on the cone mass. While there may be other changes in performance, these three effects lend themselves to easy analysis.
MASS AND DAMPING
When a woofer fires into a restricted air space, as in the throat of a horn or in a downloaded system, the result is what horn theorists refer to as a high pressure-low velocity; situation. This is a fancy way of saying that the air in the vicinity of the cone is moving (wind), instead of merely acting as a medium for traveling waves (sound). As a pressure front travels the length of a horn, of course, it undergoes a gradual transformation to a high velocity-low pressure condition, or sound wave.
In a downloaded system, no provision exists for this gradual transformation from moving air to sound wave. Instead, it is abrupt and unpredictable. We do know, however, that air has mass, which, when moving in conjunction with the speaker's cone, could have the effect of increasing the apparent moving mass of the driver. Horn designers, in fact, often calculate the volume of the air chamber behind their diaphragm expressly to compensate for the added air mass being dragged by the cone.1 In a simple downloaded system, I had expected the result of this added mass to be insignificant, but this was not the case.
Also, as the speaker pushes air back and forth between the bottom of the downloaded system and the floor, energy is lost to friction. Frictional energy losses (damping) in the driver are expressed as Qms, and Qes for electrical damping. You would expect this new loss, when added to the soup, to cause a lowered Qms, which would in turn lower Qts. A carpeted surface under the speaker might tend to increase this loss and lower Qms still further.
SETUP
I figured that information about changes in mass and damping would be easy to express in numbers. I chose to measure the effects on the driver itself, and once I quantified and expressed the effects as a change in the parameters of the driver, then extending them to a finished downloaded system would become no more difficult than in a vertically oriented system. You could simply use these amended driver parameters and proceed with a design in the usual way.
Since each design has its own problems, the changes in effective driver parameters would provide an easy way to extend the results into your finished system. Consequently, I chose to measure without an enclosure. I simply mounted a speaker to a baffle, oriented the baffle in different ways, and performed measurements in each position.
I chose an old Electro-Voice 12” woofer I had pulled from an ancient Knight 3-way system. It has a fairly low-moving mass (41gm) and a fairly high Qts (in excess of .5). These characteristics would make any changes in damping and effective mass more apparent as I made my measurements, as the effects of downloading the speaker would have a larger effect relative to the speaker’s inherent mass and damping. A woofer with high-moving mass or a very low Qts would be less affected on a relative basis than this somewhat underdamped woofer with its low moving mass.
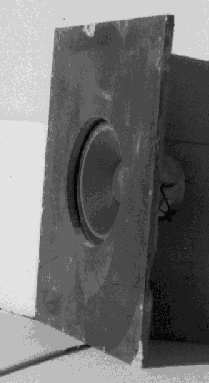
Photo 1: Vertical Speaker Baffle
I mounted the woofer in the center of a piece of ¾" particleboard scrap, about 20" x 30" (Photo 1). 1 soldered a length of zip cord to the terminals, so I could then make my measurements at the end of the zip cord, rather than at the speaker terminals themselves. This would allow me to move the speaker/baffle assembly to different positions as I made the different measurements without adding any wire. Any measurements of Q made with my fixed length of zip cord would reflect the presence of this wire in the circuit, but the results would be reliable for purposes of comparison.
I could then orient this speaker/baffle assembly in different ways to measure the effects of downloading the woofer. With the speaker placed in different positions, I could isolate the effects of downloading the speaker as I measured the Q and resonance of the woofer.
TESTS
I performed tests with the speaker/baffle assembly in six different positions:
1. With the baffle standing vertically, as in a standard system (Photo1). This would be the control, against which I would compare other scenarios.
2. With the baffle suspended woofer-down on bricks placed on their sides, one at each corner, with the baffle about 3 ½" above a concrete surface. This is the first downloaded scenario.
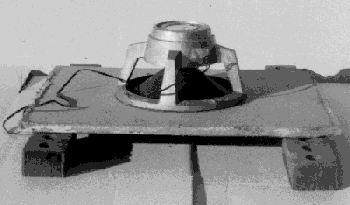
Photo 2: Test setup using bricks
3. With the baffle suspended woofer-down on bricks laying flat, one at each corner, with the baffle about 2 ¼” above a concrete surface (Photo 2). This is the second downloaded scenario.
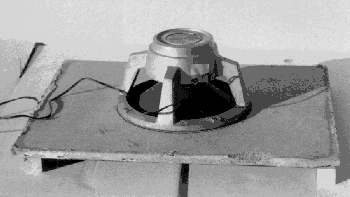
Photo 3: Lowering the baffle on blocks
4. With
the baffle suspended woofer-down on 2” x 2” blocks, one at each corner, with the
baffle about 1½” above a concrete surface (Photo 3). This is a more extreme downloaded
scenario.
5. With
the baffle suspended woofer-down on 2” x 2” blocks, one at each corner, with the
baffle about 1½” above a ½” thick carpeted surface (Photo 4).
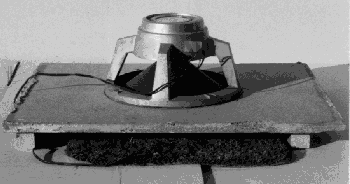
Photo 4: Testing the effects of a carpeted surface
6. With the speaker oriented vertically, but with a mass of modeling clay added to the cone's moving mass, to simulate a mass of moving air, and as a consequence remove frictional loss. This is explained in greater detail below.
These first four positions measure the increasing effects as the baffle is lowered toward the floor. As the tests were run, I hoped a pattern might emerge that would provide a feel for what to expect from the downloading technique.
In each of the six positions, I connected a standard impedance-measuring setup and measured the damping (Qs) and resonance frequencies (fs). The resonant frequency, of course, is the frequency of maximum impedance in the bass region. Qms, Qes, and Qts figures are derived from impedances measured at several frequencies. I use the standard derivation found in most popular texts.
While these tests give us a generalized idea of the effects of downloading, it is important to realize that they should be performed with a setup that more closely approximates the finished system (with a more realistic baffle size and an enclosure). Otherwise, unpredictable results could occur.
RESULTS AND INTERPRETATION
Table 1 shows the measurement results, Please note that
column 8, “EBP,” lists the calculated “Efficiency Bandwidth Product,” hich is
simply the ratio of fs to Qes, for the speaker in each position. This refers to
the popular, and very concise, method for evaluating whether a speaker is better-suited
for a sealed or vented enclosure.2 A rule of thumb states that an EBP around 50
indicates the driver will probably be better-suited to a sealed enclosure, while a value
of 100 places the speaker in a vented system.
Interestingly, the change in resonance as the baffle is lowered toward the floor is dramatic. For example, going from 38.3Hz to 33.2Hz represents a change of about 13%! We know that the compliance of the woofer’s suspension is unchanged, so the change in resonance must be due to the mass of the air in the vicinity of the cone, as it moves with the cone. We can, in turn, calculate the mass of this air for each test scenario
Table 1: Mass and Q Test Data
Test#
|
Orientation
|
fs (Hz)
|
Qms
|
Qes
|
Qts
|
Gms Air
|
EPB
|
#1
|
Vertical
|
38.3
|
5.70
|
0.651
|
0.584
|
N/A
|
58.8
|
#2
|
On 3.5" Bricks
|
37.3
|
5.90
|
0.676
|
0.607
|
2.23
|
55.2
|
#3
|
On 2.25" Bricks
|
35.4
|
5.77
|
0.683
|
0.611
|
6.99
|
51.8
|
#4
|
On 1.5" Blocks
|
34.5
|
5.71
|
0.738
|
0.653
|
9.53
|
46.7
|
#5
|
1.5" Blocks, Carpet
|
33.2
|
5.11
|
0.749
|
0.654
|
13.56
|
44.3
|
#6
|
Added Mass Vertical
|
34.4
|
6.09
|
0.753
|
0.670
|
N/A
|
45.7
|
An accepted test exists for determining i the
compliance and moving mass of a driver. When a known mass (such as a lump of’ modeling
clay) is artificially added to a speaker’s cone, the resonance is obviously lowered. The
amount by which the frequency of resonance changes reveals the speaker’s inherent
moving mass. If we already know the cone’s actual mass, however, we can determine the
mass added to the cone.
ADDED MASS
A woofer's moving mass, the change in resonance, the speaker's original resonance, and the known mass of the clay (or air in this case) are related by the following equation3:
where:
Mmd = the woofer's moving mass
M' = added test mass of clay (or air in this case)
fs = speakers natural resonance
fs' = lowered resonance with test mass added
M' = Mmd * [([fs/fs']2) – 1] (2)
where:
M' = the effective mass of air moving with the cone
As the enclosure is lowered toward the floor, the amount of air under
the baffle decreases, but the amount of air which apparently moves with the cone
increases! I was surprised at the amount by which the speaker's resonance changed in these
tests.
When referring to masses of air, I find it interesting to consider the actual physical volume of the air in question. How much air represents a gram of mass? A typical figure for the density of air at sea level is 1.29 * 10-3 grams/cm3. 4 The volume of a gram of air then, would be the inverse of this figure, or 775. A gram of air occupies about 775 cm3 of space, or about three quarters of a liter!3
Within the context of this downloaded setup, this allows us to calculate, more or less, the volume of the air under the speaker actually moving with the speaker's cone.
If we multiply the mass of the air moving with the cone (6.99 g, column 7, 2 ¼” bricks), by the volume per mass (775 cm3/gm) we get a figure for volume of moving air of 5417 cm3, effectively about 5.4 liters of moving air.
Q AND DAMPING
With regard to damping (Qs), I expected to see a clear decrease
in the figures for Qms as the woofer was lowered. The extra friction should
have a tendency to lower the Qms of the driver as the air is pushed and pulled
through the restricted air space. As a general rule, when friction goes up, Q goes down!
As Qms decreases, Qts decreases as well.
The test results, however, seem to contradict my expectations. Column 4 shows that unless carpet is added under the system to increase friction, the relationship between downloading and Qms is unclear at best. In fact, the Qms figures in the vertically oriented system and the very low (1½”) example change only from 5.70 to 5.71. The interim examples seem to gyrate somewhat, and no clear pattern occurs.
As friction is increased with the addition of a carpeted surface,
Qms decreases when compared to scenario 4. From earlier experiments, I
noticed that adding mass to a speaker’s cone generally has the effect of raising both
the Qms and Qts of a driver. Could it be that the Qms -lowering tendency of the air friction was being overwhelmed by the Qms -raising effect of the additional moving
ANOTHER TEST
This apparent conflict between two opposing consequences of
downloading the woofer suggested the last test scenario, in which the woofer is oriented
vertically, but with extra mass added to the cone to simulate a mass of moving air. By
artificially lowering the effective fs to the point of resonance in the
downloaded example, you can effectively remove the frictional loss and measure the effects
of added mass independently of the air friction.
With the speaker oriented vertically and the correct mass added
to the cone, I performed the (#6) test (Table 2). The #4 and #6 figures for fs don’t
quite match, due to the limitations of the accuracy of my work and equipment. A difference
between 34.4 -and 34.5Hz is probably less than my measurement error itself, and I chose to
ignore it.
Table 2: Air Loading vs. Added Mass
Test#
|
Orientation
|
fs (Hz)
|
Qms
|
Qes
|
Qts
|
Gms Air
|
EPB
|
#4
|
On 1.5" Blocks
|
34.5
|
5.71
|
0.738
|
0.653
|
9.53
|
46.7
|
#6
|
Added Mass Vertical
|
34.4
|
6.09
|
0.753
|
0.670
|
N/A
|
45.7
|
But, when you compare the results of these two
tests, the frictional loss in test #4 does appear to lower Qms substantially. When the frictional loss is
removed, as in test #6, Qms is increased from 5.71 to 6.09. In the downloaded
system, with the loss in place, Qts is
decreased from .670 in test #6 to .653 in test #4. I characterize this change as
substantial. Apparently, the frictional loss associated with downloading itself is
significant; however, it tends to be obscured by the more influential effect of an
increase in effective moving mass, resulting in a general increase in Qts when a woofer is download.
EFFECT OF DISPLACEMENT
A woofer in its position of equilibrium, or zero excursion, in a standard vertical orientation (Fig. 4) normally is manufactured with its voice coil centered in the magnetic gap (note the position of the voice coil as indicated by the arrow). One effect of mounting the speaker face-down (or face-up) is that the earth’s gravitational field exerts a force on the moving system of the unit, which tends to pull the voice coil out of its centered position. Figure 5 shows a driver face-down, with the inset showing the voice coil slightly displaced from center (arrow).
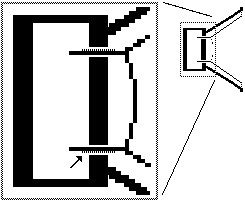
Fig. 4. Voice Coil Centered in Gap in Vertically Oriented Mounting
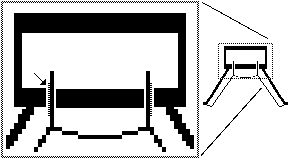
Fig. 5. Voice Coil Pulled From Center Position When Mounted Horizontally
The magnetic field of the speaker’s magnet is concentrated in
the magnetic gap. The turns of wire that make up the voice coil are immersed in this
field. As electrical current passes through the voice coil, the magnetic field exerts a
force on each turn of wire. The equation describing the force on a conductor in a magnetic
field is:
F = Bli (3)
where:
F = force on the conductor,
B = magnetic field strength
l = length of the conductor immersed in the magnetic field
i = electrical current in the conductor
You can see from this equation that when Bl remains constant,
force is proportional to current. The length of the conductor in the field, in the special
case of a loudspeaker, is equal to the length of each turn of wire times the number of
turns in the gap. As long as the number of turns remains constant, the “Bl product”
will be a constant as well, and the speaker will work as it should, with force on the
voice coil in direct proportion to current through the wire voice coil.
In extreme situations, when a speaker is required to reproduce
signals with long woofer excursions, a voice coil will sometimes move far enough to exceed
the length of the windings. This over-excursion causes the number of turns of wire in the
gap to be reduced from that when the driver is in its equilibrium position (Fig. 5). When this happens, the BI product is
reduced, because as the number of actual turns decreases when excursion is long, the
effective length of wire in the field decreases.
As the Bl product decreases, the force on the voice coil is no
longer in direct proportion to input current, and the performance of the motor is
nonlinear, i.e., distortion or breakup occurs. The Xmax parameter describes one-way linear excursion limit.
Par = f34 * Vd2/(3*108) (4)
where:
Par = displacement-limited power handling
Vd = volume of air displaced at maximum linear excursion
f3 = 3 dB down point
In turn,
Vd = Xmax * Ssd (5)
where:
Xmax = maximum linear excursion, and
Ssd = cone area
Consequently,
Par = f34 * (Xmax * Ssd)2/(3 * 108) (6)
Actual displacement-limited power handling is proportional to the
square of Xmax, so any reduction in Xmax will have a disproportionate effect on actual system power
handling. As gravity exerts a force on the speaker’s moving assembly, and the voice coil
is in turn displaced from its centered position, power handling can be reduced.
POWER-HANDLING REDUCTION
Gravity’s force on a speaker’s moving assembly is equal to
the mass of the moving system times the acceleration due to the earth’s gravitational
field:
Fmd = Mmd * g (7)
where:
Fmd = force on the moving system in dynes,
Mmd = the speaker's moving mass in grams
g = acceleration due to the earth's gravity,
= 9.80 meters/sec2 = 9.80 * 102 dyn/gm
Dg = Fmd * Cms (8)
where:
Dg = displacement due to gravity in cm, and
Cms = speaker compliance in cm/dyn
Amended Xmax would then be equal to original linear excursion minus displacement due to gravity.
Xmax' = Xmax - Dg (9)
where:
Xmax' = amended linear excursion limit
Par'/Par = (Xmax'/Xmax)2 (10)
where:
Par' = amended displacement limited power handling.
Using these equations, along with a speaker’s mass and
compliance data, you can then see what effect gravity can have on power handling in a
downloaded system. Without linear excursion data (Xmax) for my old Electro-Voice, I used the manufacturer’s data for
several drivers to calculate the anticipated loss in linear excursion and
displacement-limited power handling (Table 3).
Table 3: Power Handling Reduction in Several Drivers
Driver
|
Mmd
(gm)
|
Fmd
(dyn)
|
Cms
(m/N)
|
Cms
(cm/dyn)
|
Disp
(cm)
|
Xmax
(cm)
|
Xmax'
|
Par'/Par
|
Audax HM100XO
|
3.23
|
3165.4
|
0.00225
|
0.00000225
|
0.0071
|
0.23
|
0.2229
|
0.939
|
Peerless 1599
|
12.2
|
11956
|
0.00015
|
0.00000015
|
0.0018
|
0.3
|
0.2982
|
0.988
|
Eton 11-580
|
23
|
22540
|
0.000094
|
0.000000094
|
0.0021
|
0.4
|
0.3979
|
0.989
|
Audax PR300MO
|
33
|
32340
|
0.000264
|
0.000000264
|
0.0085
|
0.44
|
0.4315
|
0.962
|
Dynaudio 30
W-100
|
35.2
|
34496
|
0.000121
|
0.000000121
|
0.0042
|
0.8
|
0.7958
|
0.990
|
Madisound 12204
|
106
|
103880
|
|
0.00000048
|
0.0499
|
0.6
|
0.5501
|
0.841
|
Audax PR380MO
|
115
|
112700
|
0.000062
|
0.000000062
|
0.0070
|
0.38
|
0.3730
|
0.964
|
Madisound 15254
|
160
|
156800
|
|
0.00000048
|
0.0753
|
0.55
|
0.4747
|
0.745
|
In the event you
need to determine your own figures, here is the simple mathematical relationship between
mass, compliance, and resonant frequency:
fs = 1/[2*PI*(Mmd*Cms)1/2] (11)
You can derive compliance from figures provided for resonance and
moving mass:
Cms = 1/[(2*PI*fs)2*Mmd] (12)
Make sure you use consistent units. For example, in Table 3, I converted rn/N in column 4 to cm/dyn in
colunm 5. This information indicates that the
effects of gravity on voice-coil centering range from significant to inconsequential The
two woofers most affected (the two Madisound models) both exhibit high-moving masses and
high compliances, as you’d expect.
Keep in mind that these calculations are parameter related, and
indicate nothing about the relative quality of any of the units listed. They may, however,
provide an insight into their relative usefulness for downloading.
As a rule of thumb, when evaluating a woofer’s suitability for
downloading, high mass and compliance are your enemies, if high power handling is a
consideration. A high figure for a speaker’s Xmax is your friend, as gravitational displacement will be smaller
compared with the original Xmax.
CONCLUSIONS
These tests demonstrate that downloading a woofer can change a
woofer’s apparent parameters. As a system is oriented horizontally and lowered toward
the floor, the driver’s frequency of resonance decreases due to an apparent increase in
moving mass, as air in the cone’s vicinity moves with the cone itself. This added mass
results in an increase in driver Qts, which the frictional loss associated with
the movement of this air somewhat mitigates.
As the speaker designer, you can anticipate a moderate increase
in effective Qts and a decrease in apparent fs when you download a
woofer. The best conditions involve a woofer with a somewhat low Qts or one
with a somewhat high inherent fs. In practice, this would suggest a speaker
with an EBP that needs to be decreased, or that might become more useful through a
reduction in EBP. In addition, using such a system over a carpeted or other “lossy”
surface can significantly affect damping, and can lower Qts, or at least reduce
the increase in Qts.
From this look at the effects on mass and damping, it is clear that
to proceed with a design of this type without some careful consideration could produce a
system that does not operate as intended. If you capriciously apply this technique to a
woofer without accounting for its effects, you’ll be working with design goals that
could be vague, and achieve an unpredictable result. When carefully used, however,
downloading can change effective driver parameters in special cases, i.e., when the driver
could be helped by a lower fs, higher Qts, or lower EBP.
Another effect of downloading is that the force of gravity tends
to pull the voice coil from its centered position, resulting in a decrease in maximum
linear excursion for the driver and a decrease in displacement-limited power handling.
This effect will vary in importance from woofer to woofer, and will be most harmful in
drivers exhibiting high compliance, large moving mass, and short inherent linear-excursion
capability. Be sure to evaluate the effect gravity will have on the woofer before choosing
REFERENCES
1. Abraham B. Cohen, Hi-Fl Speakers and Enclosures, Hayden Book Company
1968, pp. 248-~249.
2. Vance Dickason, Loudspeaker Design Cookbook, Marshall Jones Co.,
Third Edition, 1987, p. 5. Attribution to Small.
3. David B. Weems, How to Design, Build and Test Complete Speaker Systems, Tab Books, 1978, pp. 73 and75.
4. Richard Small,
and Margolis, “Personal Calculator Programs,” JAES, June 1981, p. 422.